


Data sources:
Tian et al. 2024 Global Nitrous Oxide Budget 1980–2020. Earth System Science Data.
Importance:
Nitrous oxide (N2O) is a long-lived potent greenhouse gas and stratospheric ozone-depleting substance, which has been accumulating in the atmosphere since the pre-industrial period because of human activities. The concentration of atmospheric N2O has increased by nearly 25% from 270 parts per billion (ppb) in 1750 to 336 ppb in 2022 (Tian et al., 2024). Understanding the dynamics of the global N2O budget and attributing changes to different sources is fundamental for tracking climate change. It will contribute to the global stocktake of the Paris Agreement to track progress towards nationally determined contributions and the ultimate goal of achieving net-zero GHG emissions.
The Nitrous oxide budget:
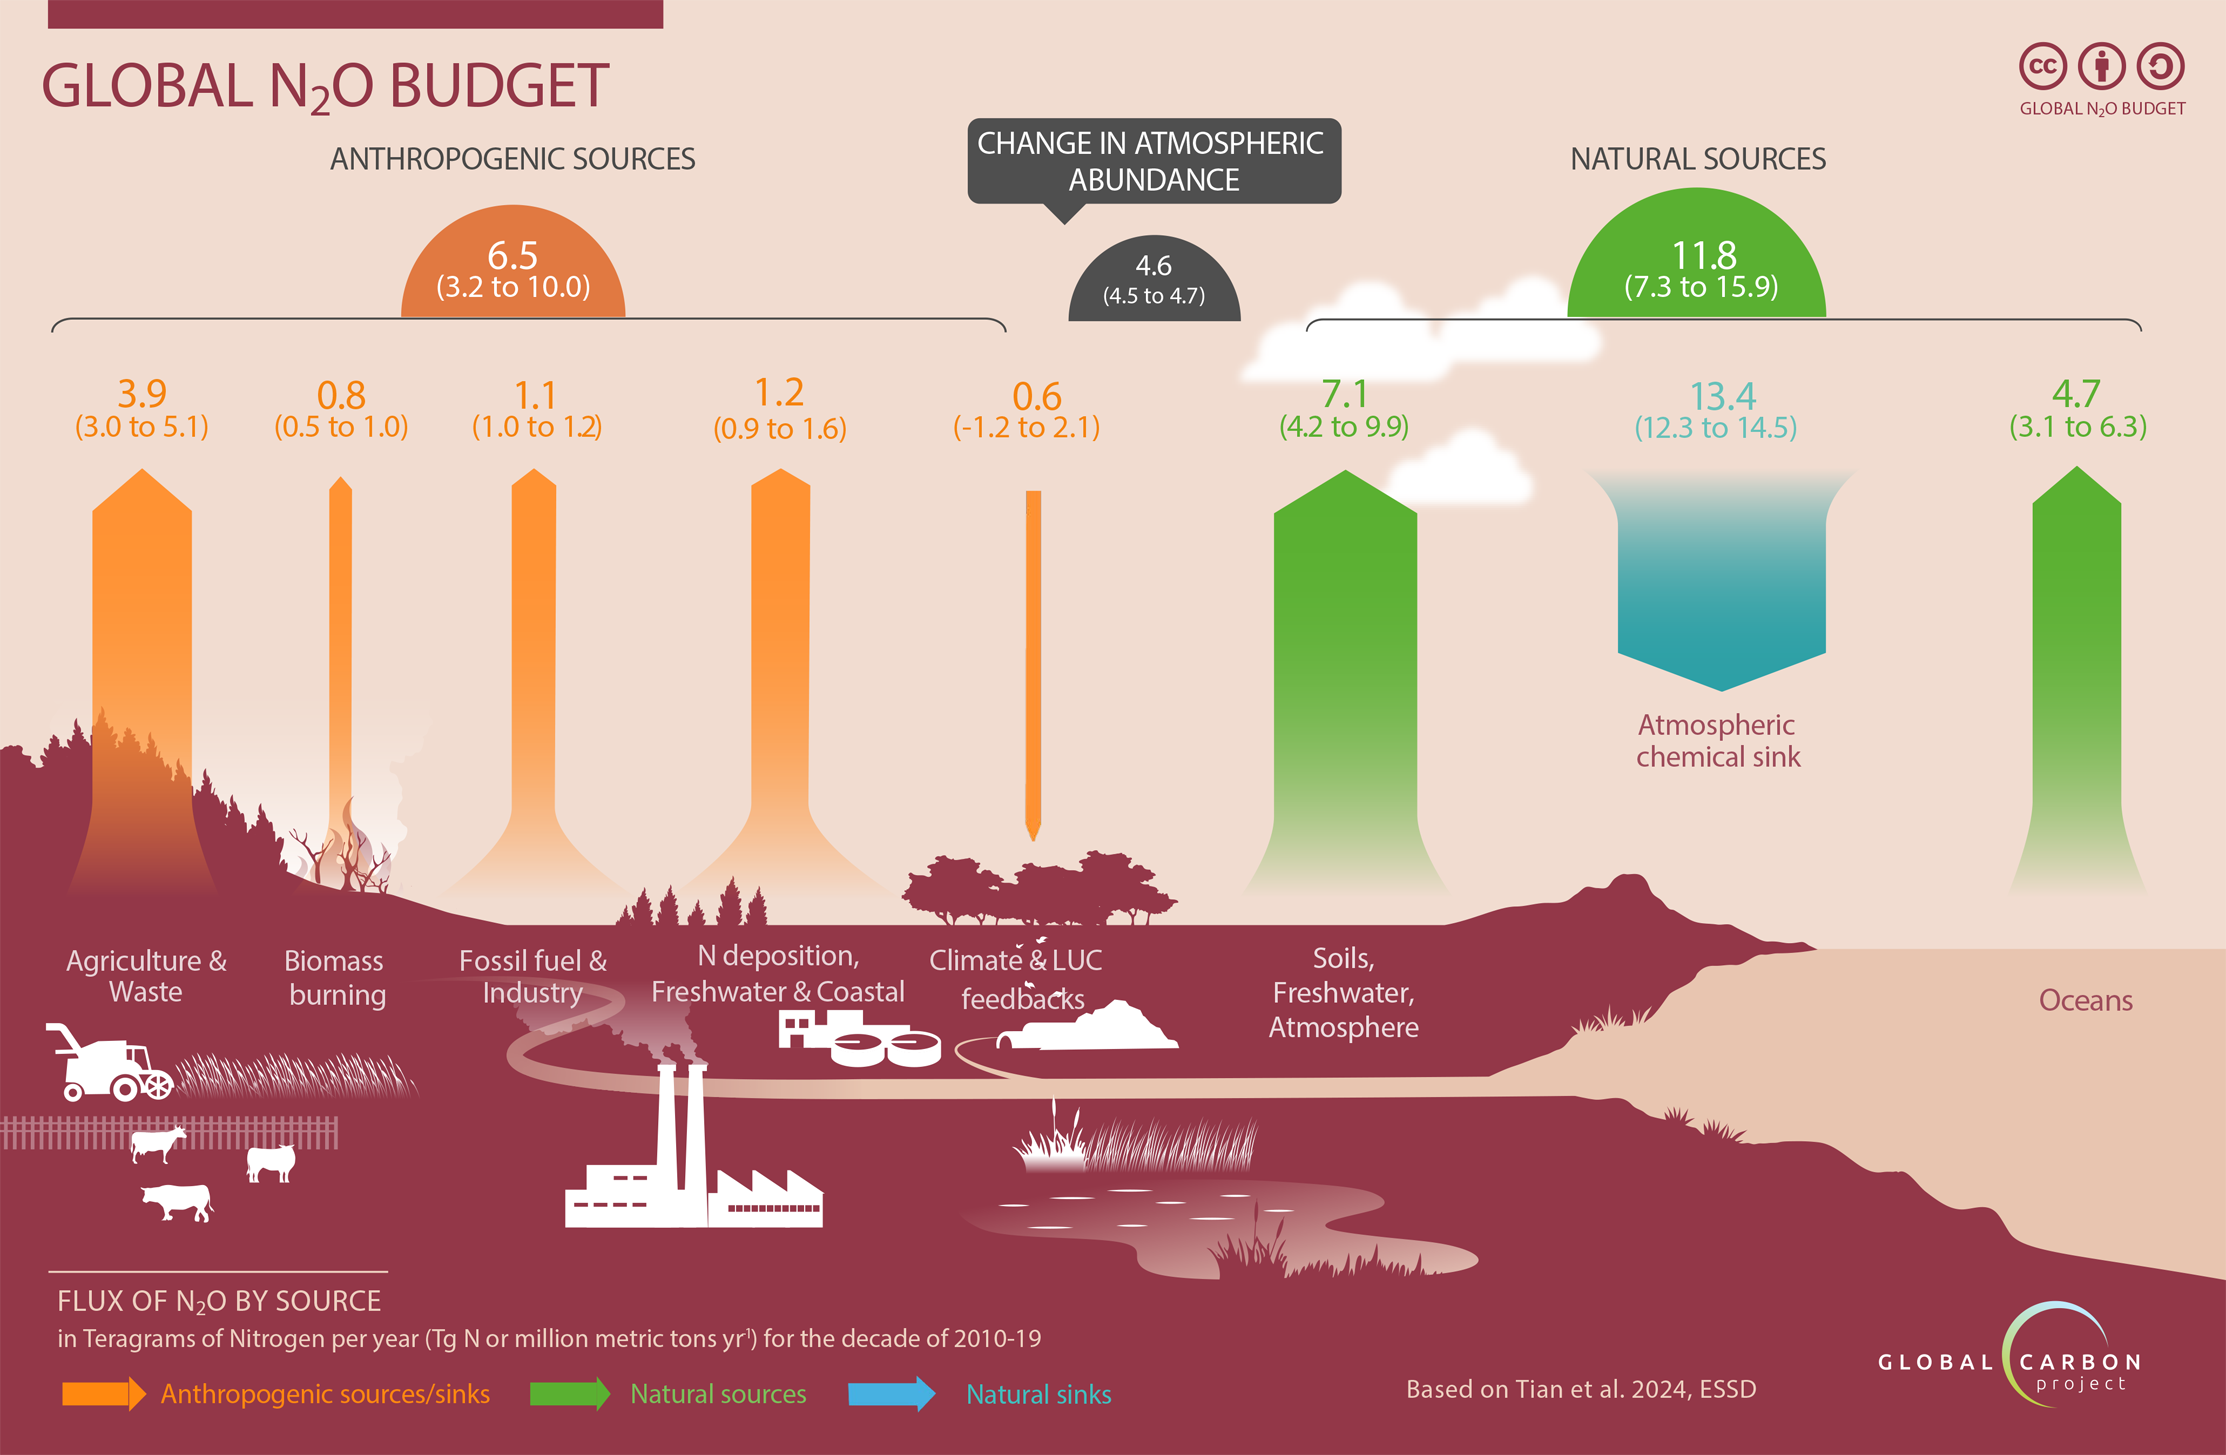
The nitrous oxide (N2O) budget, as described here, refers to all sources and sinks of N2O resulting from both human activities and natural processes. Natural sources accounted for 65% of global total emissions during the decade of 2010-19. Among these fluxes, natural emissions from soils made the largest contribution (35% of global total emissions), followed by the coastal and open oceans (26% of global total emissions). Other sources, including natural inland waters, estuaries, coastal vegetation, lightning, and atmospheric production, constituted 4% of the global total emissions. These natural sources have existed since before the Industrial Era and remained relatively stable.
Of the total global N2O emissions, anthropogenic emissions only accounted for 35% in the last decade (2010-19), but they are the major drivers of increasing global N2O emissions and atmospheric concentrations since pre-industrial times. The largest component of anthropogenic emissions is direct agricultural emissions (from fertilizer use, manure management, and aquaculture), which accounted for 20% of the total emissions. Other direct emissions from human activities (12% of the total) are emissions from fossil fuels, industry, waste, wastewater, and biomass burning. We also account for indirect emissions (6% of the total emissions) from freshwaters and coastal ecosystems. Finally, we have other emissions that come from the indirect actions of human activities through the effects of changes in climate, atmospheric CO2 concentration, and land cover, that together result in decreased N2O emissions (-3% of total emissions); however, these latter fluxes are not well constrained, and their amounts are highly uncertain.
Of all N2O emitted into the atmosphere, only about one-quarter remains there, contributing to climate change. The rest is destroyed in the atmosphere through the processes of photolysis and oxidation.
Estimating the N2O budget:
The Global Carbon Project has established a consortium of more than 50 research institutions around the world to gather the observations, statistics, and biogeochemical and chemical global models to improve and update the N2O budget every 2-3 years. The N2O budget is estimated at the global scale using both “top-down (TD)” and “bottom-up (BU)” approaches. BU approaches include diverse data inventories (e.g., amount of fertilizers used, manure production), observation-driven methods, and process-based models. We also use atmospheric models (TD) that optimally combine measurements of atmospheric N2O concentrations and atmospheric transport models. Based on BU methods, we report N2O flux estimates, globally and at the national level, for five source categories: “Direct agriculture emission”, “Other direct emission”, “Indirect emission”, “Perturbed fluxes from climate/CO2/land cover change”, and “natural emission”.
Under the leadership of the Global Carbon Project in partnership with the International Nitrogen Initiative, Tian et al. (2020), Nature reported the first comprehensive global N2O budget using multiple BU and TD methods, with regional and sectorial estimates, covering the period 1980-2016). The recent Tian et al., 2024, Earth System Science Data presents an improved and updated global N2O budget (1980-2020) and its regional attribution to 18 land regions and three ocean regions.
Uncertainties:
As the number of available datasets is uneven and generally small, uncertainties of N2O fluxes are reported in brackets as a range between the minimum and maximum estimates. Perturbated N2O fluxes from climate/CO2/land cover change are the most uncertain part and the consortium of scientists is making every effort possible to improve the modeling and supporting datasets. In comparison, the long-term trends in N2O emissions from other anthropogenic sources are better constrained.
Future work:
As part of its scientific goals, the Global Carbon Project team will further develop more complete and better constrained N2O budgets with regular updates. For further information visit the Global Carbon Project (GCP) web page.